- Year:
- 2023
- Role:
- Product Designer
- Scope:
- UX / UI Design, Branding
- Platform:
- iOS, Android
Data visualization app UI kit
A mobile UI kit with reusable charts and data display components for finance, crypto, banking, and sports apps.
Context
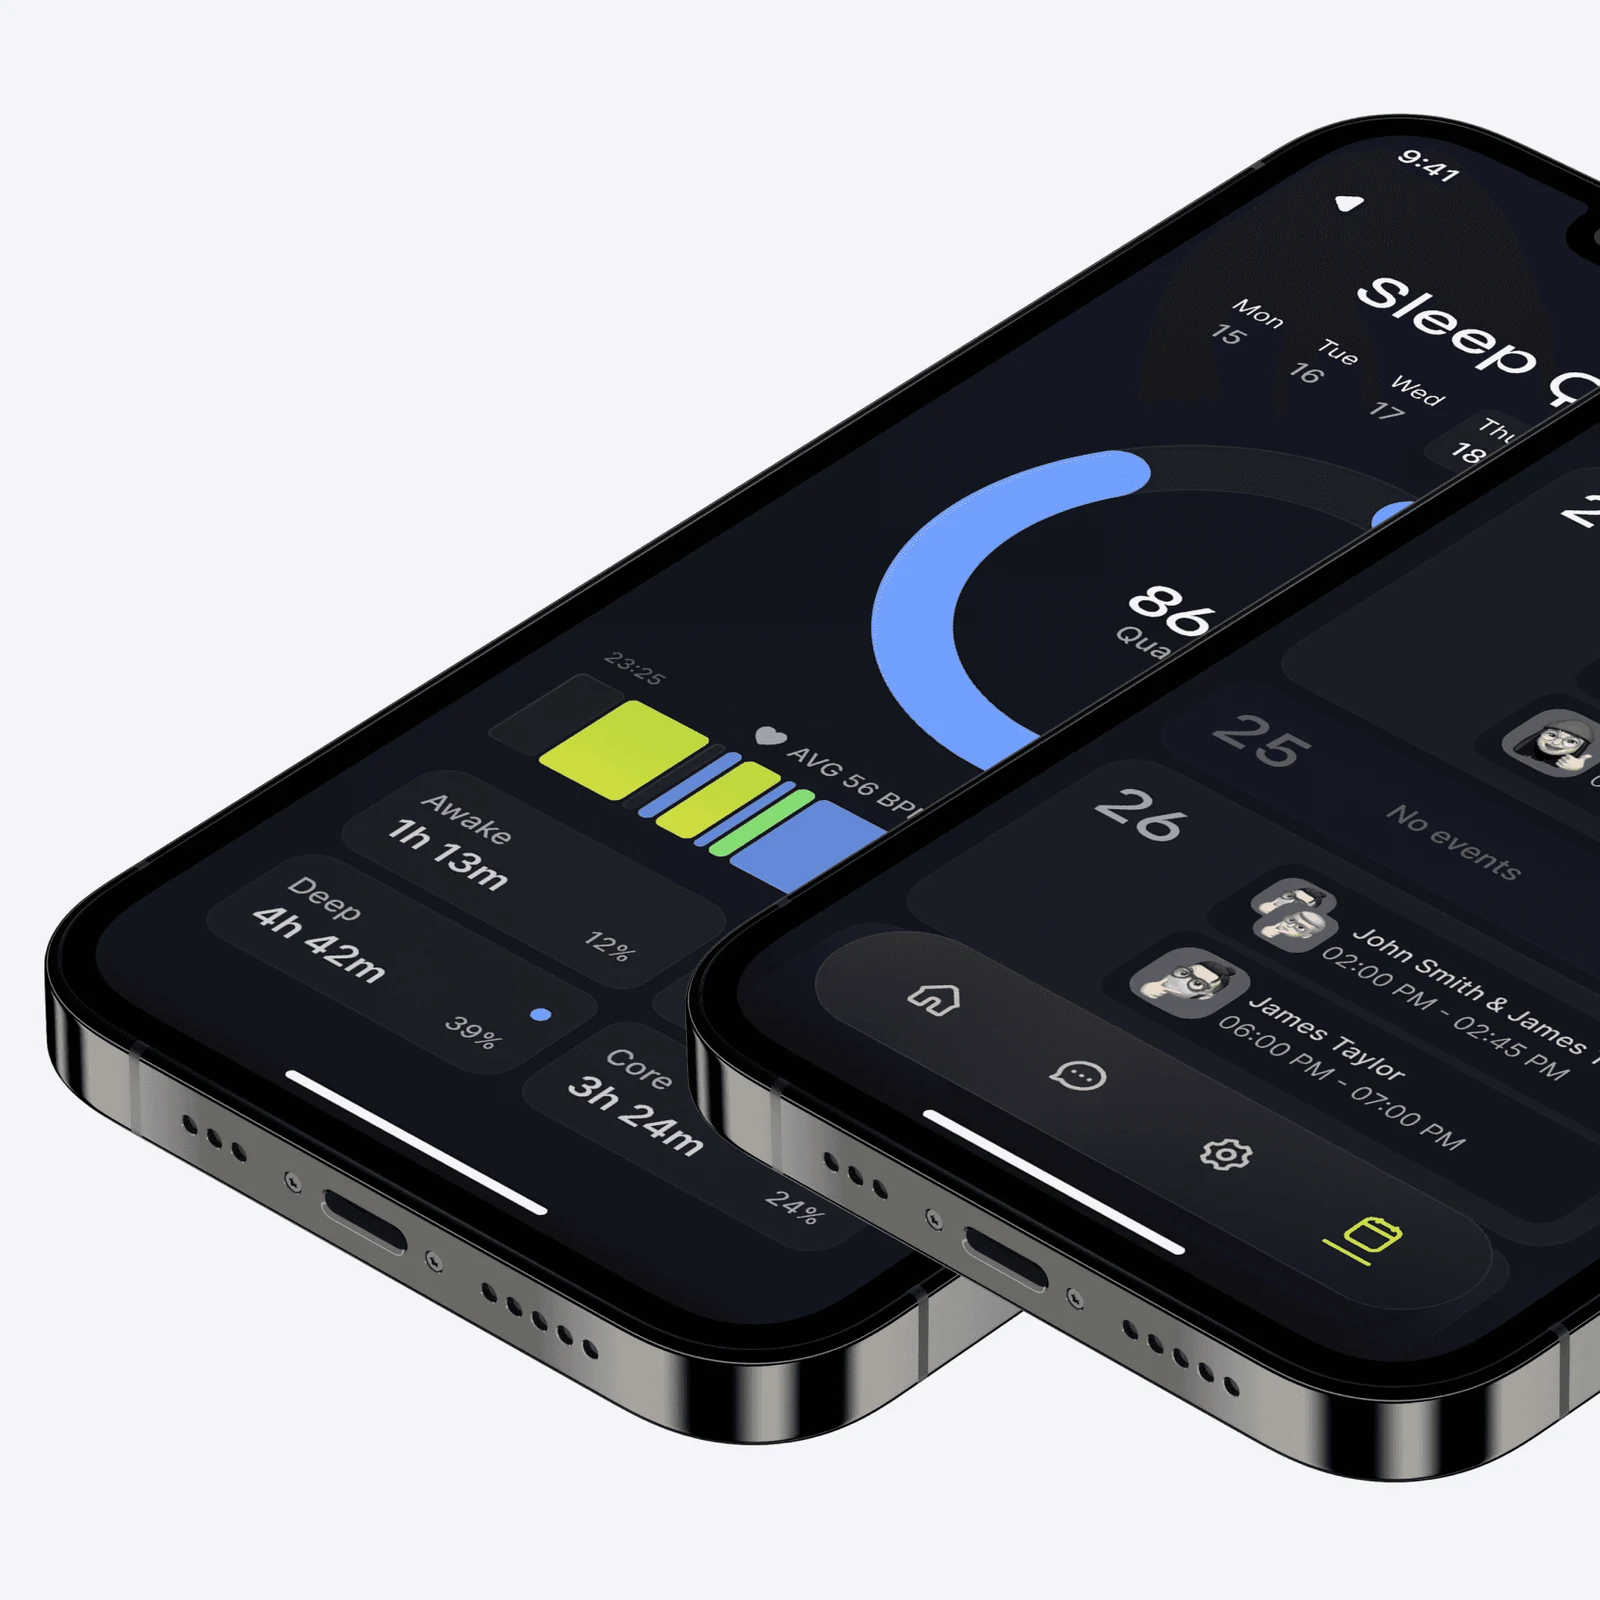
I've always been interested in working with data visualization, so I decided to make UIKit, which covers a set of elements that can be used in mobile applications.
Process
I decided to use a product approach while working on the UI Kit. The end users of my product are other designers and it's easy enough for me to understand what they want to see in my product.
Research
I researched common data visualization patterns in mobile apps, including how people read and interact with charts. I also studied examples from finance, crypto, banking, and sports apps.
I selected five visualization types based on how often they were used and how useful they were in practice: bar charts, line graphs, donut charts, progress bars, and heat maps.
UI
The next stage was the creation of prototypes of all pages of the future UI Kit. My task was to cover the most typical examples of using data visualization.
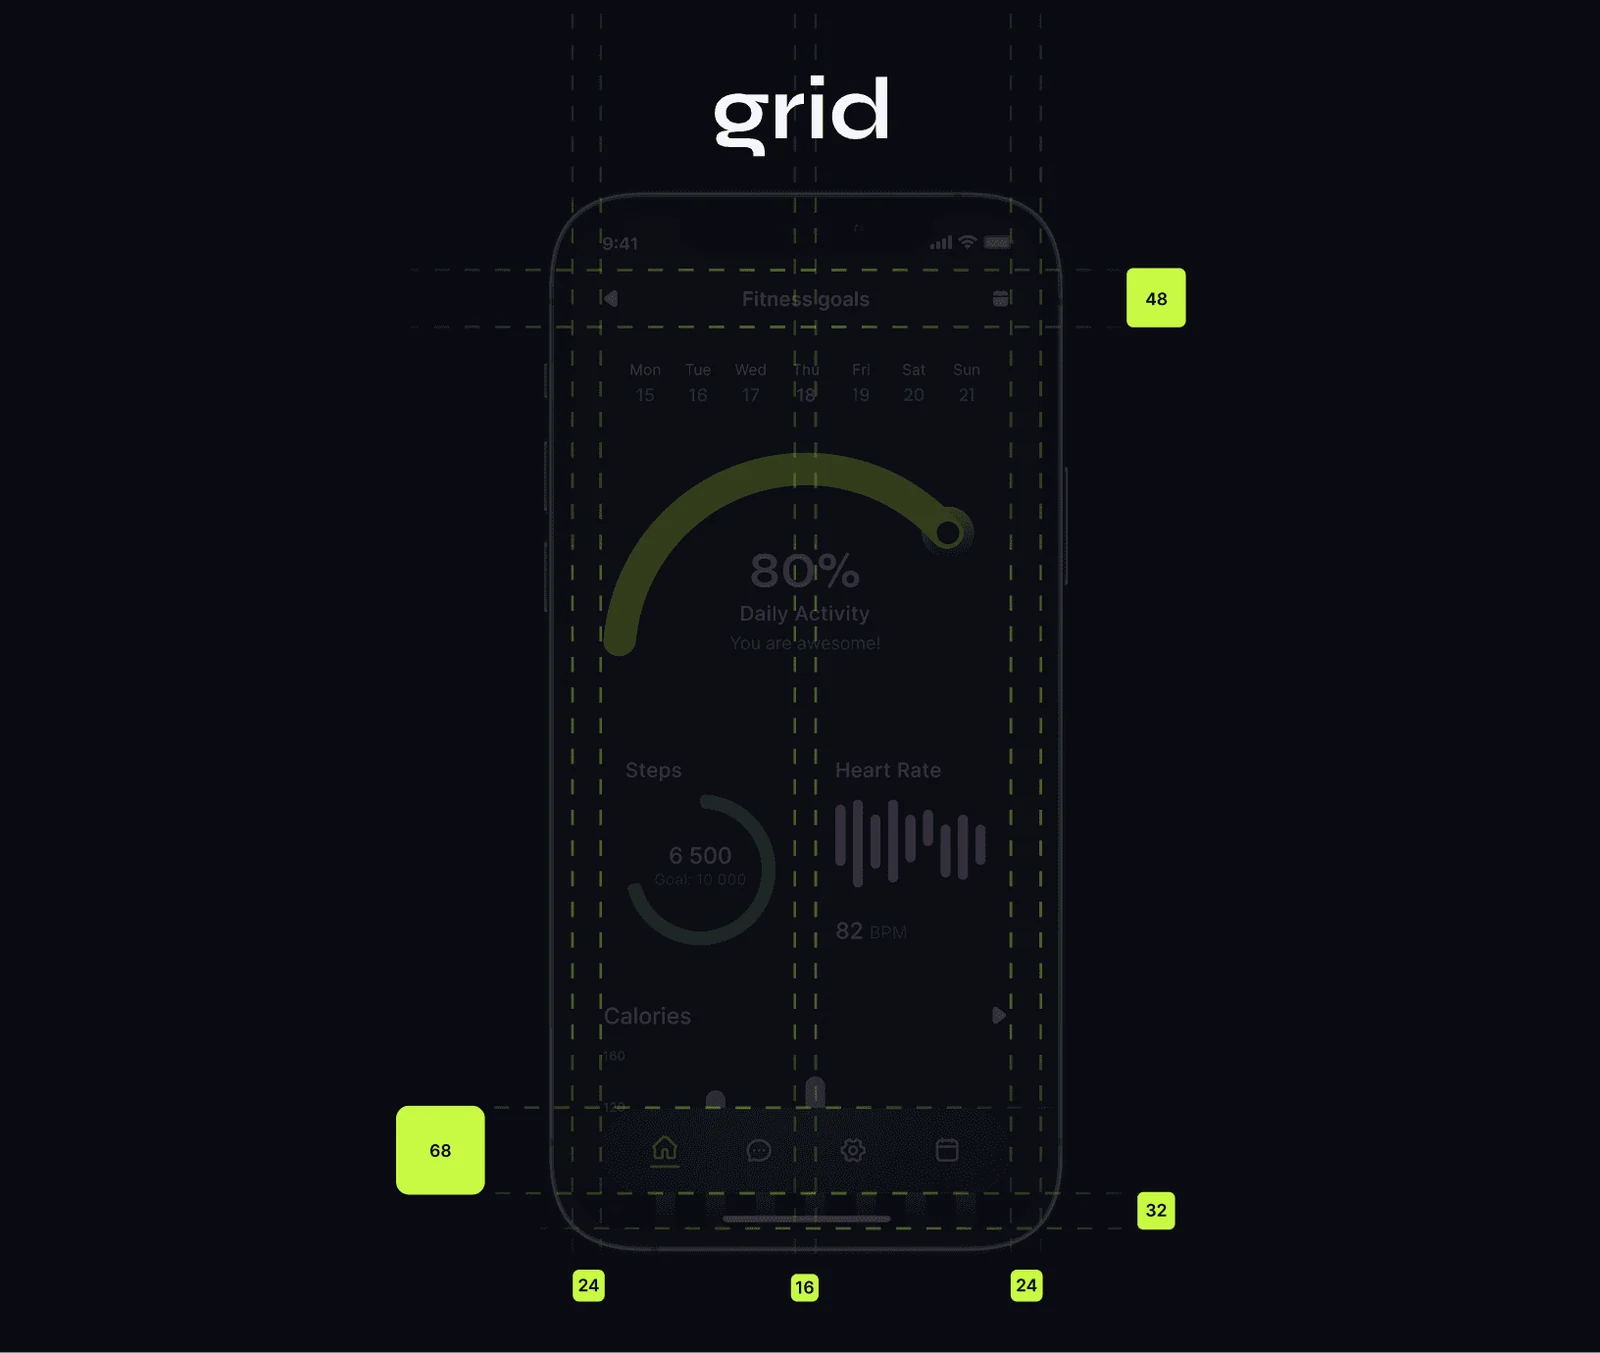
When the prototypes were ready, I focused on working out the UI as well as the design system. This allowed me to immediately determine the set of necessary elements and quickly refine the screens.
Launch and support
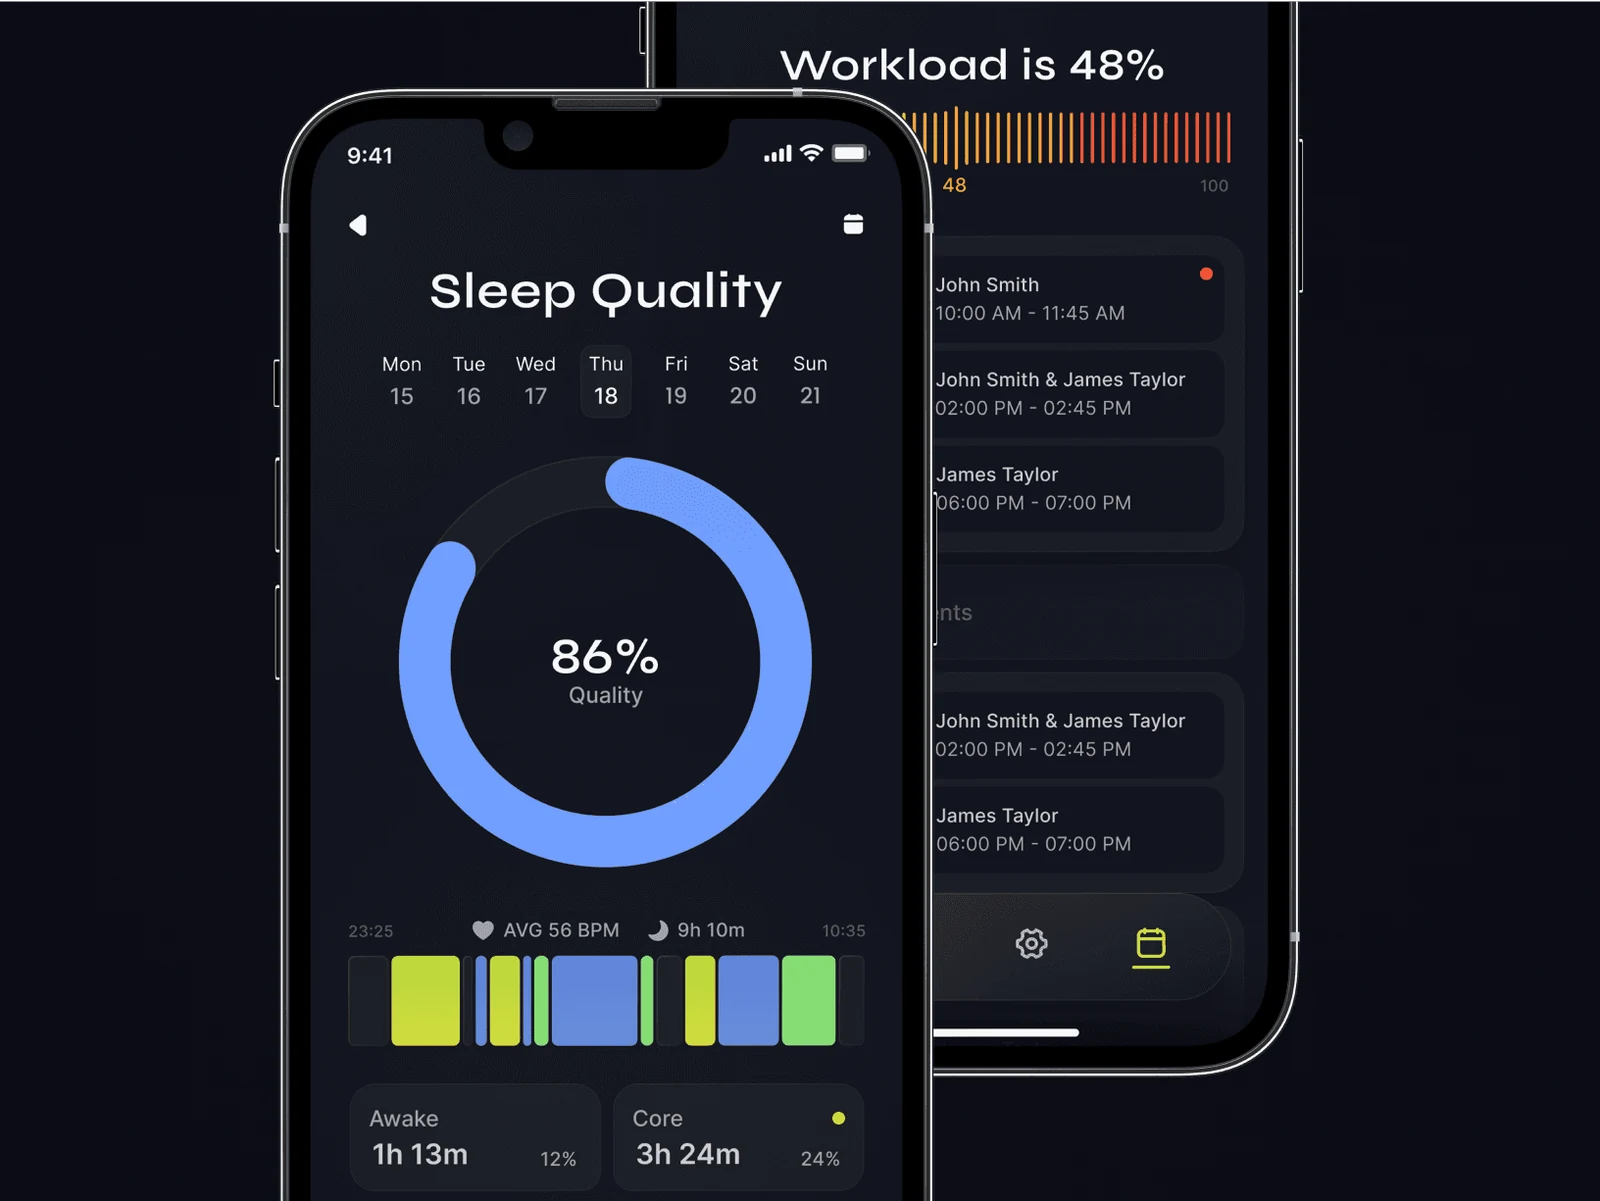
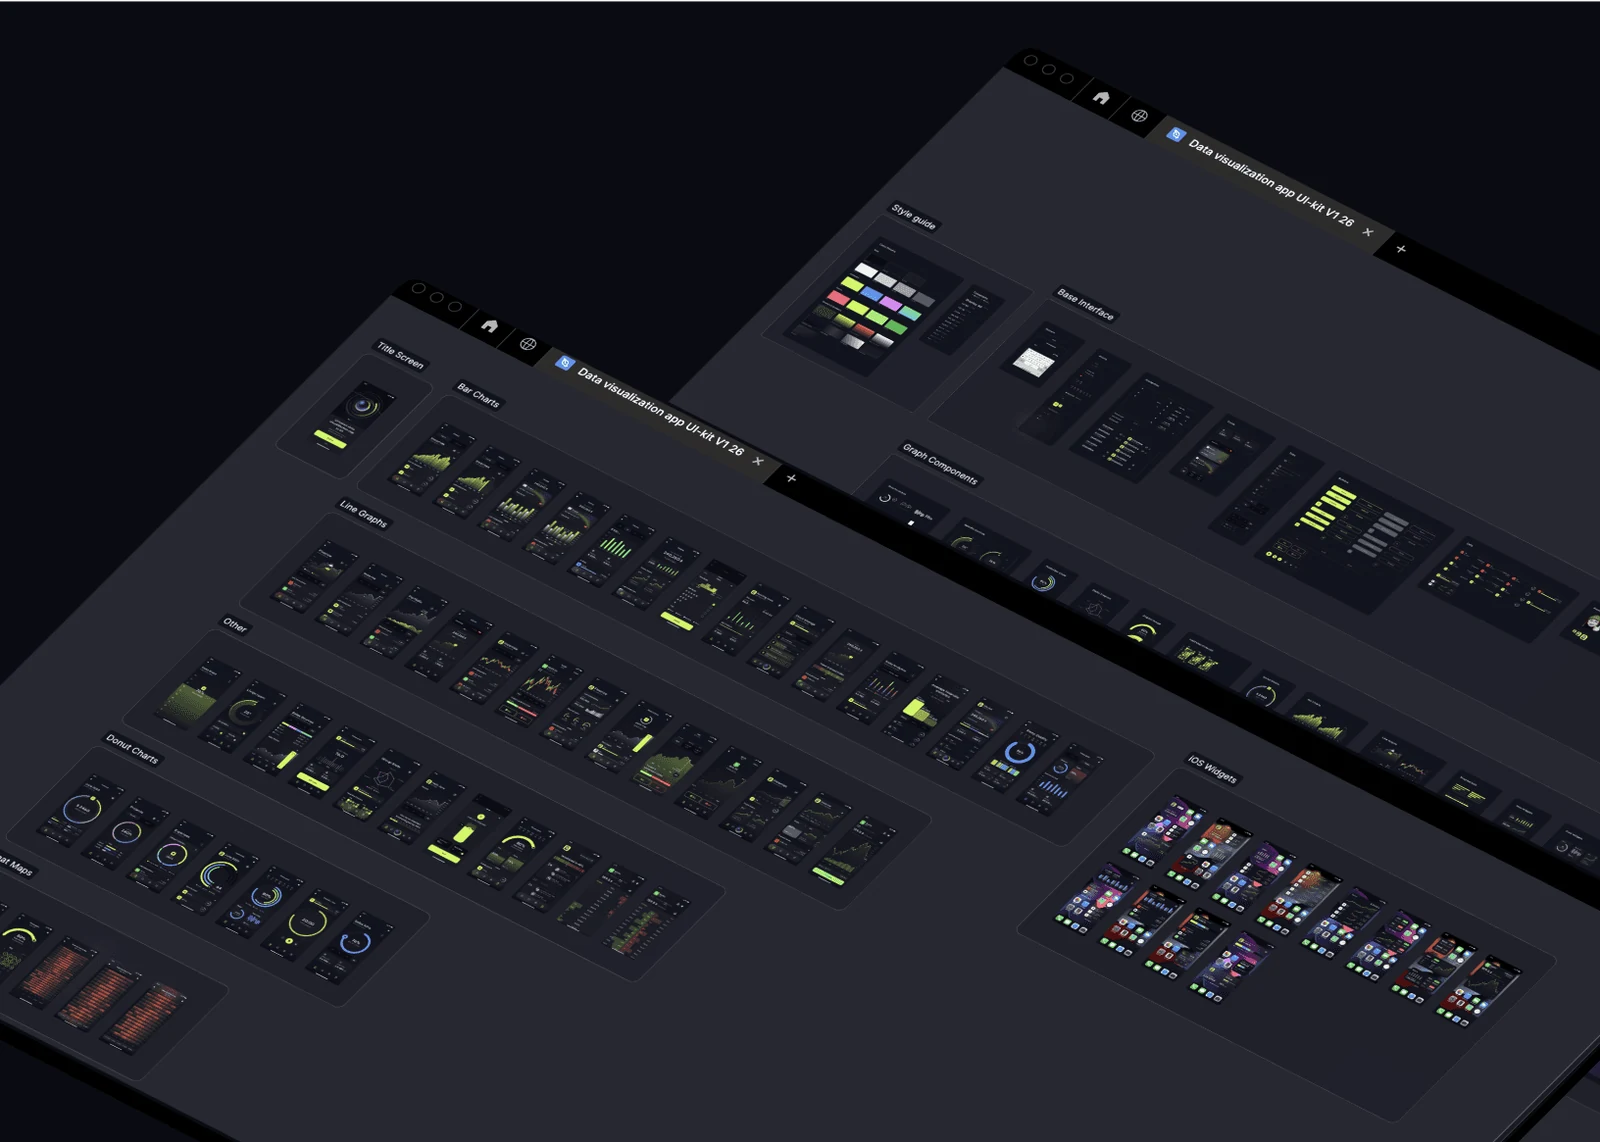
After launch, I released 28 updates, expanding the component library and the range of data visualization options. Feedback from UI kit users helped me find and fix errors and prioritize improvements.
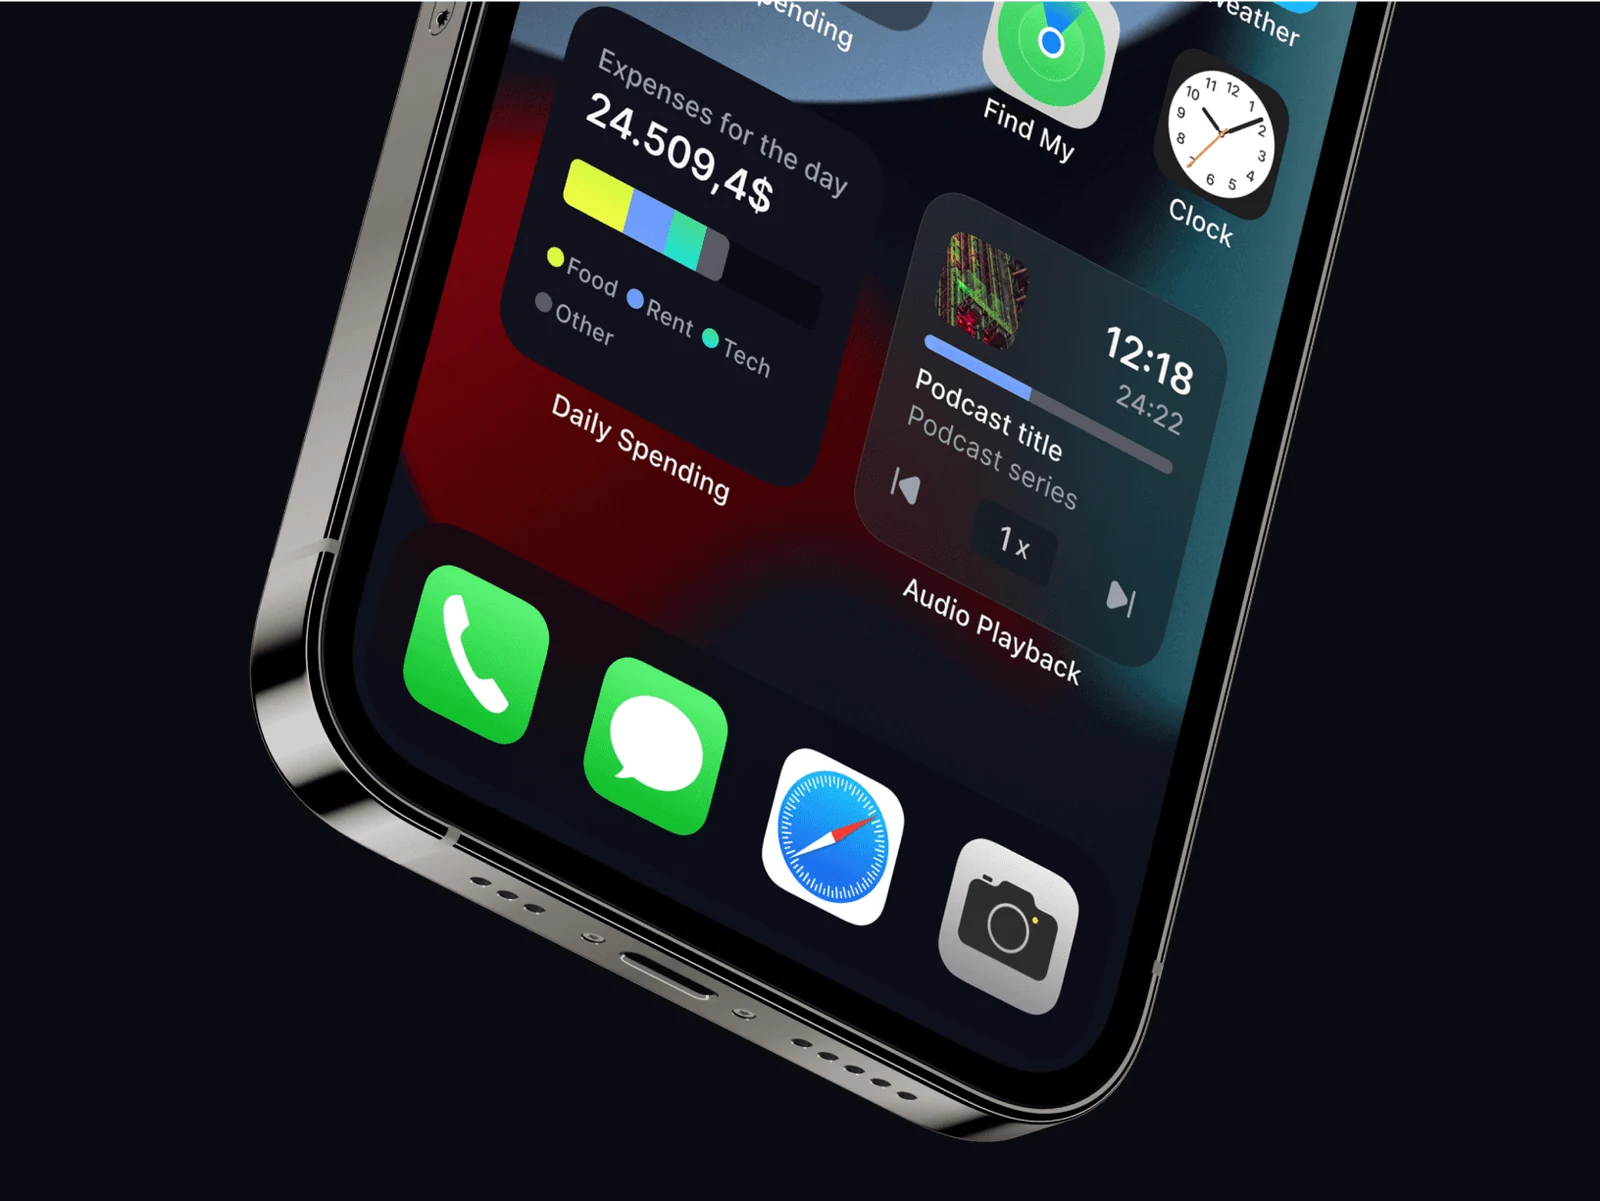
I later explored how the components could work in iOS widgets and shifted my focus in that direction.
At the moment I am no longer updating the Data visualization app UI-kit.
Next Project